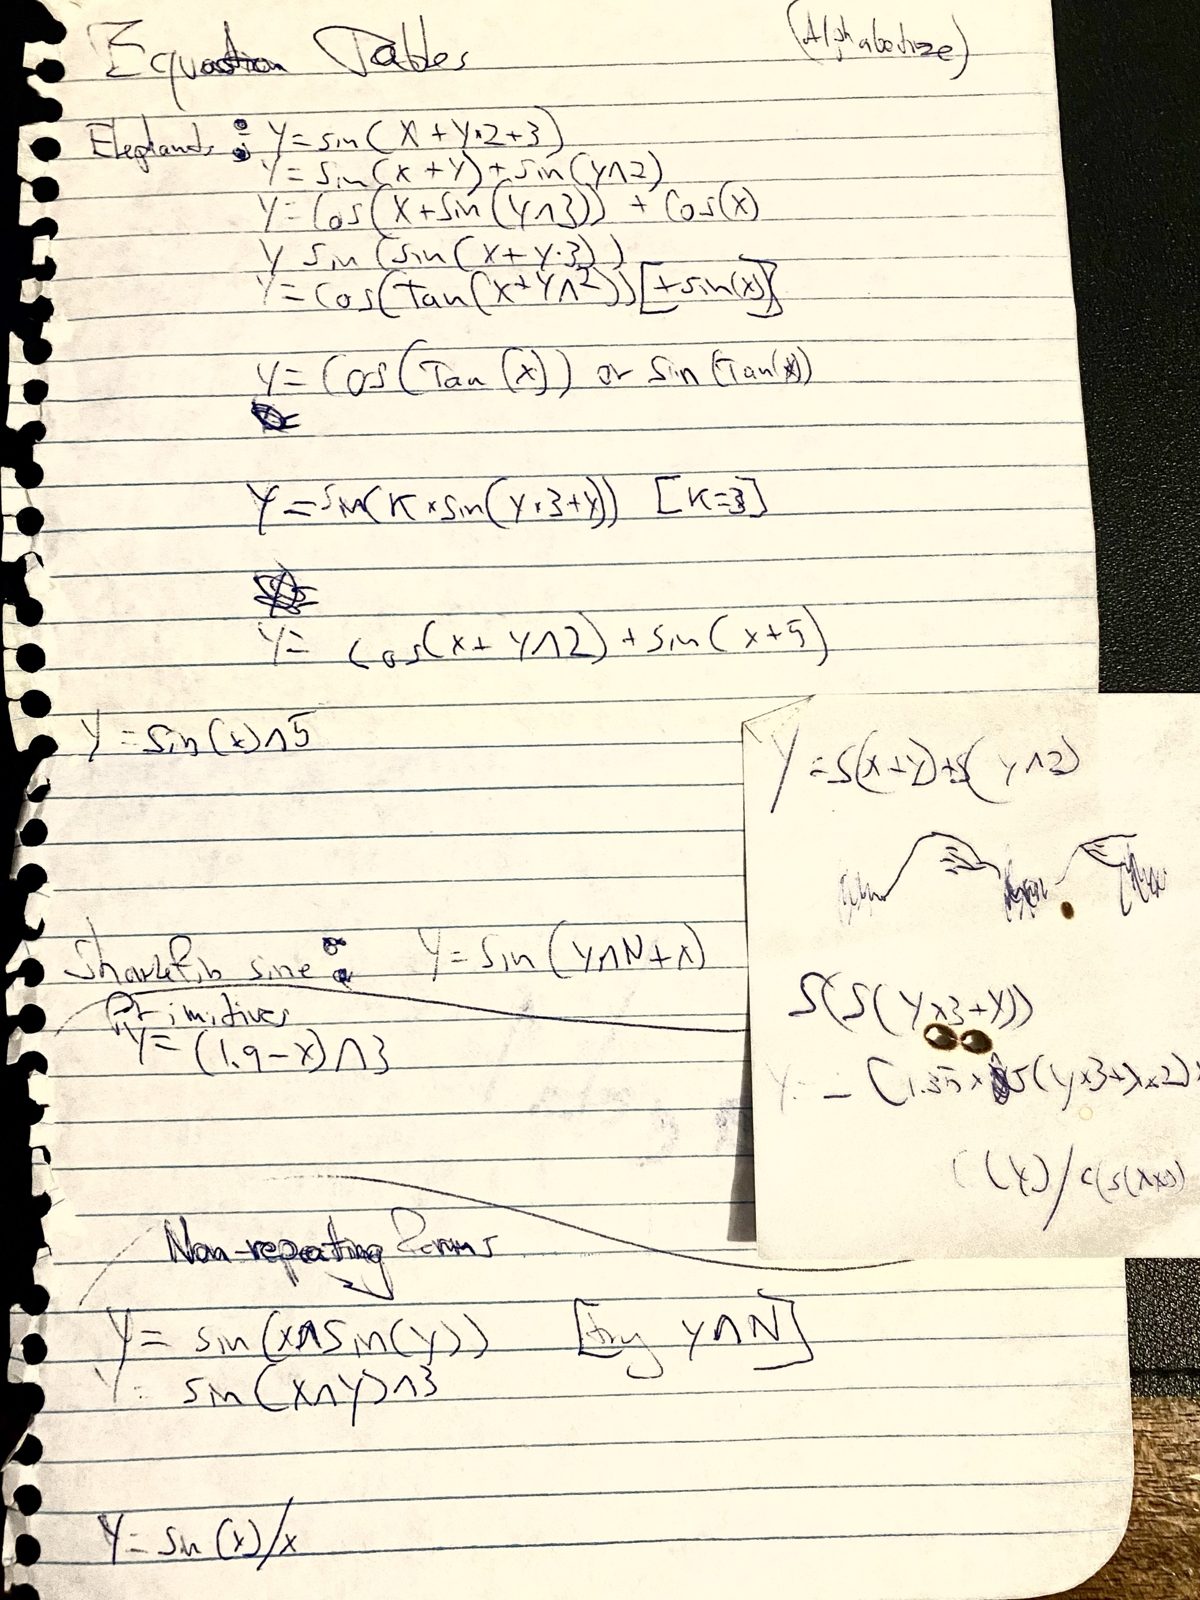
In 1987 I had an Amiga and a habit of plotting equations to see what they looked like. Some of the ones I tried fed their own output back in: Y = sin(X + Y·2 + 3), Y = sin(X + Y) + sin(Y²), and a few dozen variations. I held X as a dial, let Y run, and plotted every value it visited.
What came out were branching trees. A single line split into two, then four, then eight, then dissolved into a cloud, with clear bands of order reappearing inside the cloud. I didn't know what they were. I wrote the equations down so I could get back to them, gave the families names like "Elephants" and "Shark-fin sine", and later wrapped the plots around a spinning cylinder, like a zoetrope, so they filled in as they turned.
They were bifurcation diagrams, and the branching is the period-doubling cascade that Mitchell Feigenbaum had explained more than a decade earlier. He found that the splits arrive faster and faster at a fixed ratio, 4.669…, and that the same ratio appears in any map of this shape. That is why my sine and cosine variations all produced the same trees.
To be clear about it: nothing on this page was new. Feigenbaum, Coullet and Tresser had the theory, and experiments had confirmed it in real fluids by 1980. My notebook was an untrained rediscovery, reached by experiment and by eye with no knowledge of the literature. What interests me now is the route: finding structure by computing it and looking at it, which is the same instinct behind Computational Reflective Imaging.